chicago-crime-dataviz
Analysis and visualizations about crime in Chicago.
Chicago Crimes Data Visualization
Data visualization allows faster communication – to better find patterns that would be impossible to see just by looking at the numbers and also provides the possibility to interact with the data itself.
For this project, we explored a data set about crimes in the city of Chicago in order to uncover insights and answer four different questions.
Results of interest:
Please feel free to jump straight to the results:
- Interactive Shiny app where you can explore how socioeconomic indicators are related to the amount and types of crimes in different areas of Chicago.
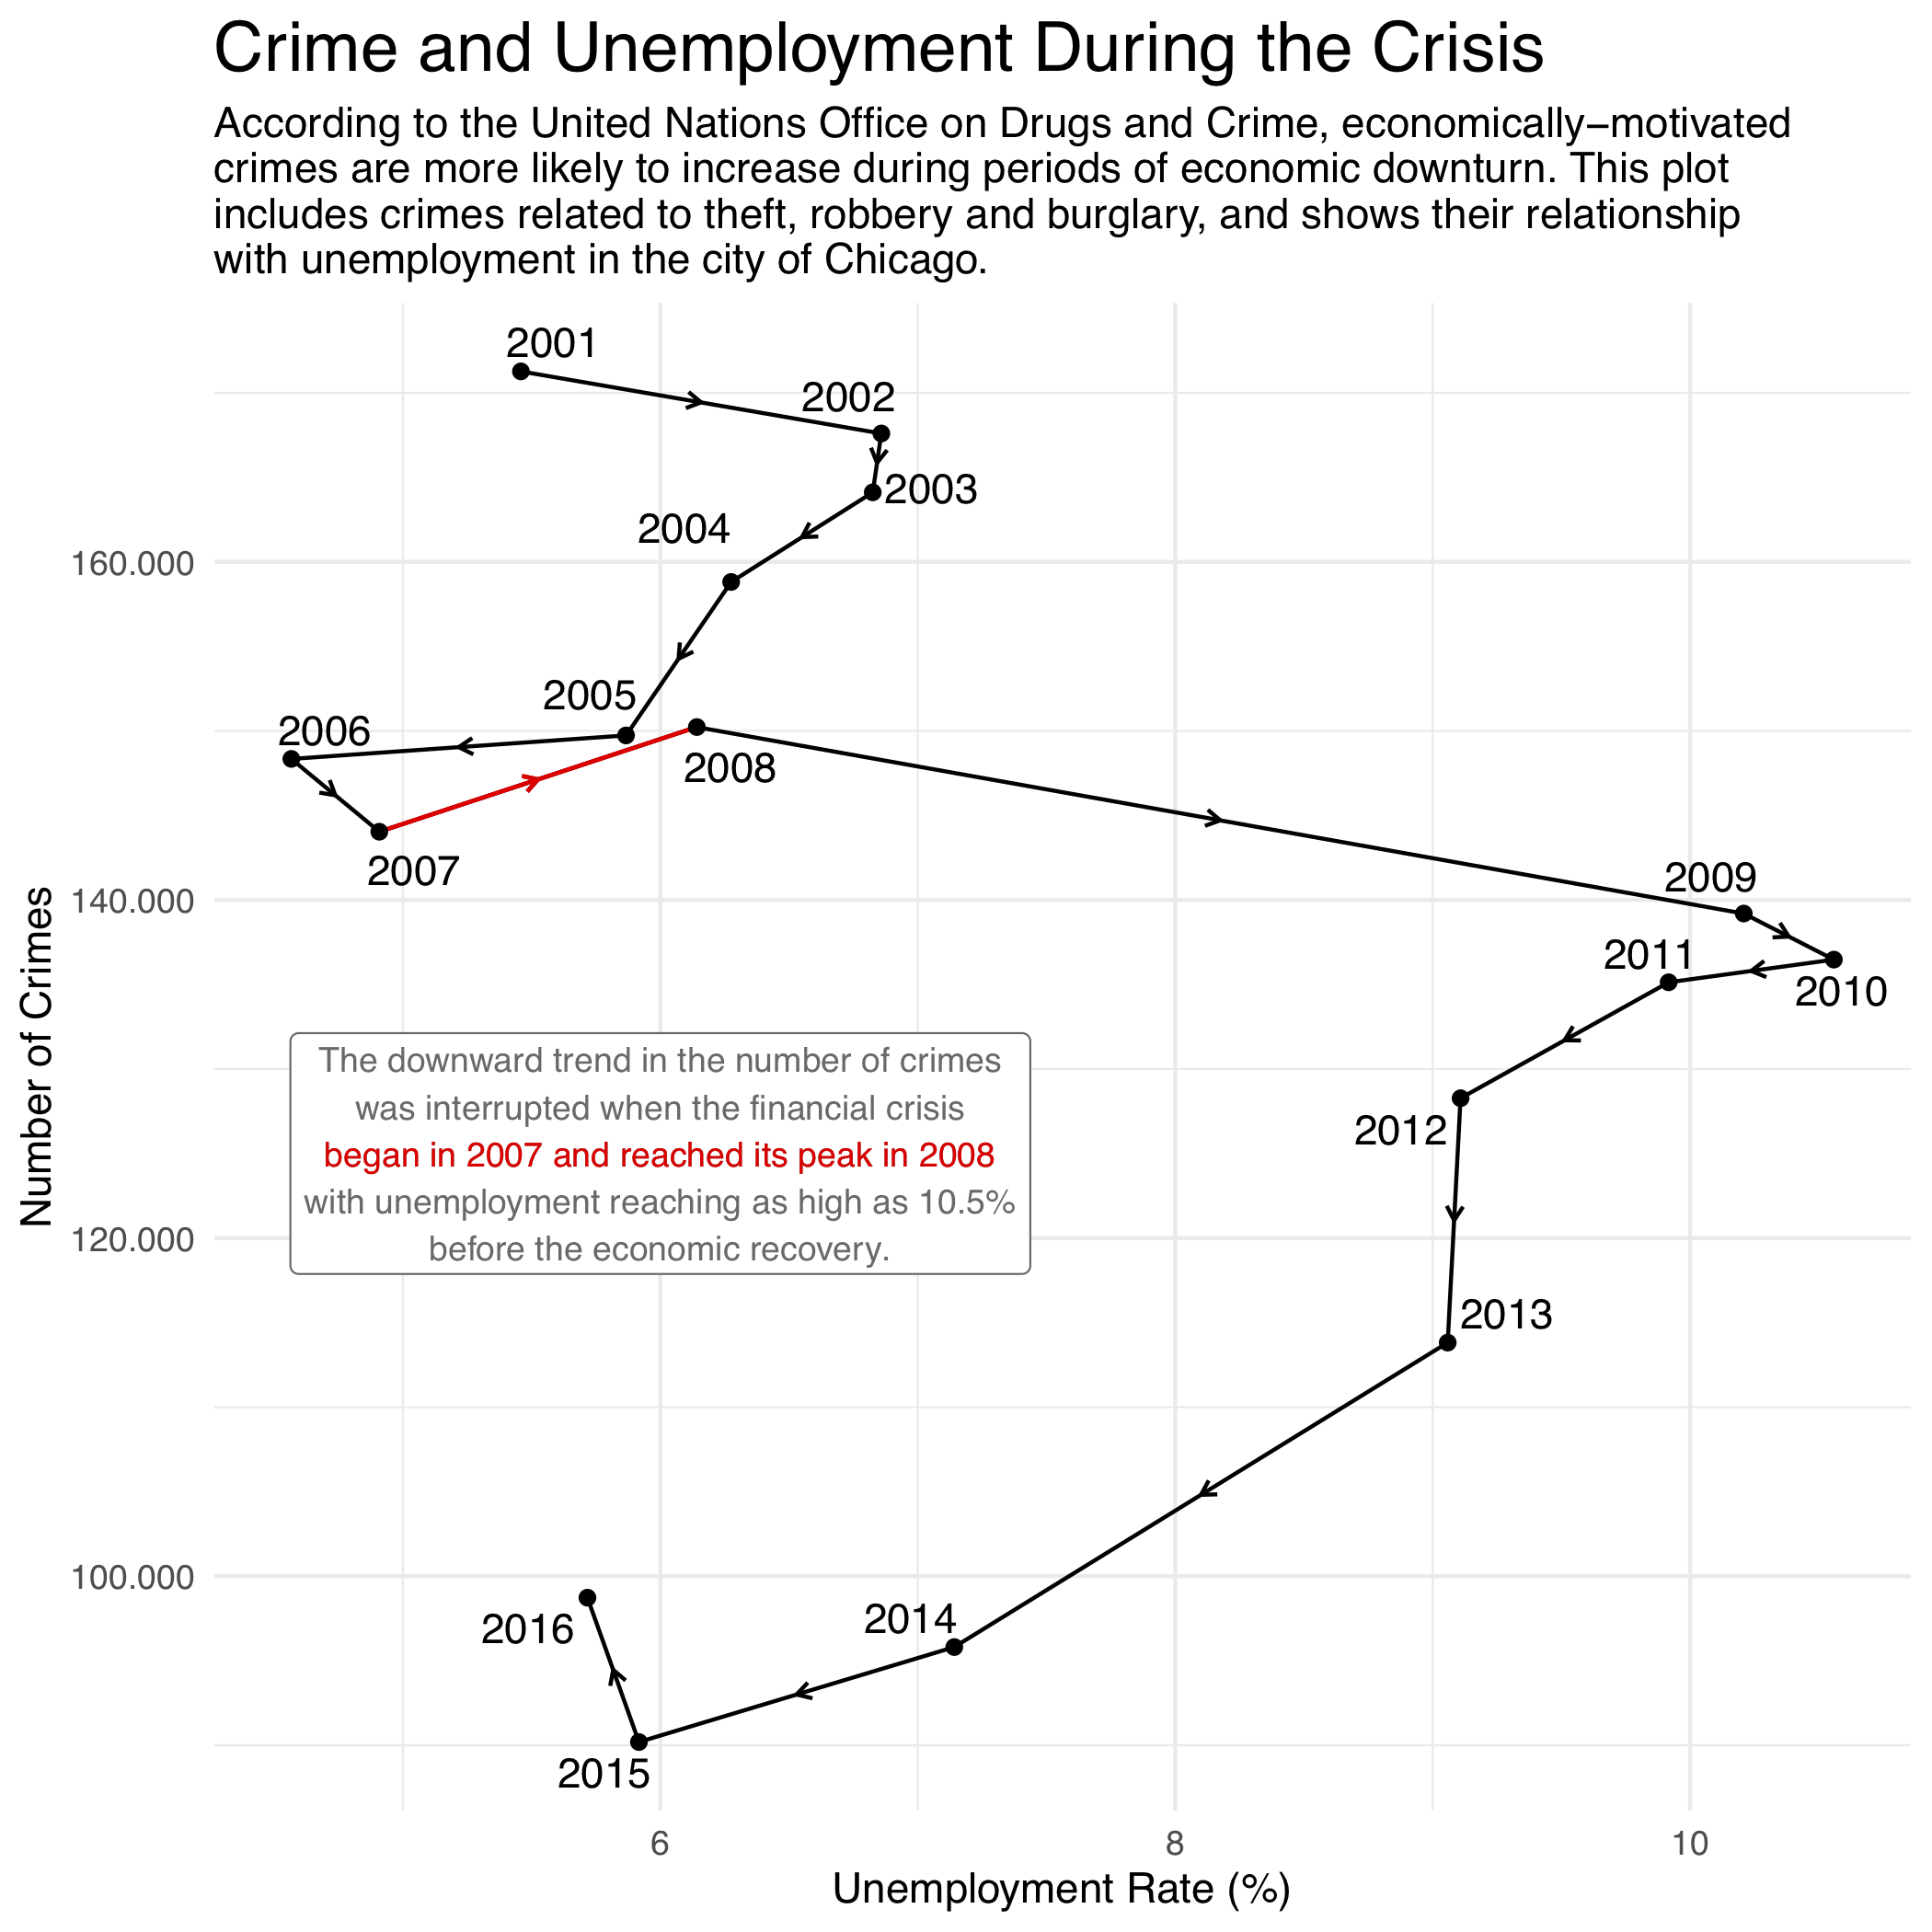
- Check out the report with visualizations produced, such as:

Or, of course, you are welcome to browse the code.